What is a "real world" workload and why do I care?
'Real World' workloads refer to the IO activity that 'actually' occurs on your SSD or HDD. IOs (or Input/Output Operations) are the data transfers that go to and come from your Storage. Your SSD performance depends on the type of IO activity that occurs during your Real World use. While synthetic benchmark tests are used to evaluate and characterize SSD performance in the lab, Real World workloads indicate how your SSD will actually work when you use your computer.
Why is it important to understand the composition of my real world workload?
Real World workloads are important because SSD performance is highly dependent on the IO Streams that the SSD 'sees'. For example, a particular SSD may be very fast for large block SEQ READ workloads and very slow for small block RND WRITE workloads. If you select an SSD based on one or the other, the actual occurring workload can result in much different performance. Understanding your workload can help you select the best drive for your application or help you to avoid over spending for 'too much' performance.
In a larger perspective, increased community understanding about Real World workloads can help SSD manufacturers, designers and system integrators optimize SSDs and provide better solutions for the end user.
What is the IOProfiler and how does it work?
The IOProfiler (IPF) is a small applet that you load on to your target computer/server that captures statistics on the IO streams that your SSD/HDD 'sees'. The IPF characterizes statistics on each IO stream that accesses your computer storage (either LUN, pool or individual device). These statistics are saved to a small file that you upload to testmyworkload.com for data visualization and analysis.
No individual or personal data is accessed or recorded. Only statistics on IO streams (described as RND/SEQ accesses of data transfer sizes in R/W ratios) and information on the hardware, OS and type of storage used are saved. These IO streams are tabulated and reported for presentation in the IPF IO Stream Map and LBA Map.
What do I have to do?
Just download and click the IPF applet to start your free IO Capture. Merely select the time to run the capture (duration) and the IO resolution (in seconds). Your IO traffic will be noted in the IPF GUI. When complete, your IPF file is saved in the indicated directory (My IO Captures folder). Next, just upload the file to testmyworkload.com automatically with the IPF applet, or manually on My Captures page, and take a look at your capture.
What do I see when I view my real world workload capture?
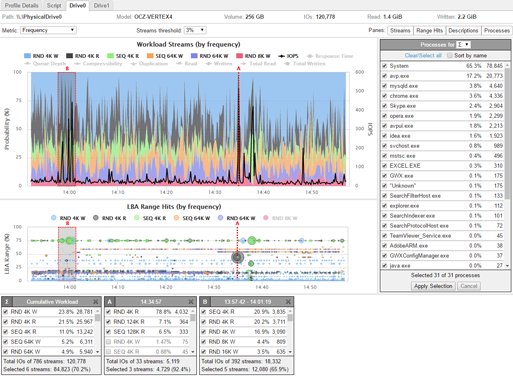
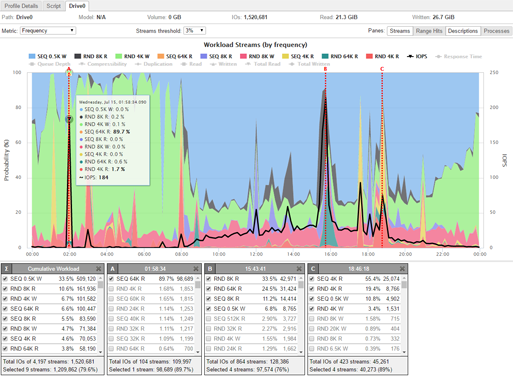
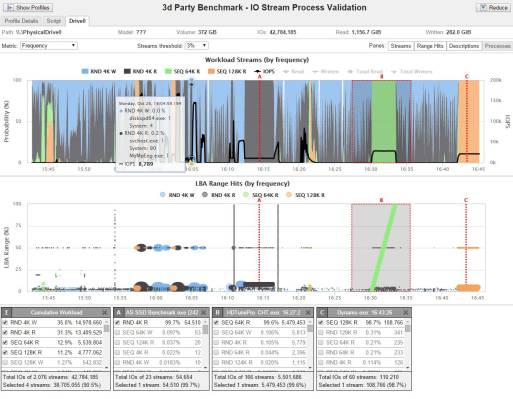
Your free IO Capture gives you access to the IO Stream Map, cumulative workload composition for the test period and a list of processes (applications) that occurred during the test period. When you join the IPF IO Capture Program, you get additional features such as the ability to highlight and see segments of your composite workload and an LBA hit map of storage accesses.
You can contact Calypso for more advanced segment analysis and testing of SSDs using your real world workload as well as see interesting reports and tests in the IPF IO Reporter portal.
Why should I participate in the IPF IO Capture Program?
Your participation in the IPF IO Capture Program can help the SSD industry more clearly understand what exactly happens when you use your computer and applications. Current SSD manufacturers do not test or optimize SSDs based on real world workloads, primarily because there is no central repository with enough captures to provide them with data to optimize the SSD and compute systems. By doing captures and adding to the IPF Global Database you are making a contribution to the industry wide IO Capture database.
By joining the IPF IO Capture Program you gain access to the IPF IO Reporter portal that will publish reports, tests and comparisons of SSD performance using workloads aggregated from the IPF Global Database.
How does all of this help me get better performance from my storage?
Better definition and understanding of user IO workloads will help SSD and system designers and manufacturers optimize SSD storage and software layers to improve overall performance. By building a global database, Calypso will be able to aggregate and identify application workloads by hardware and software configuration and
to compare workload performance on different types of storage tiers, clusters and devices.
How can this help me select the best SSD for my use case?
Watch the IPF IO Reporter portal for comparison studies and description of common applications run on systems with similar hardware, software and storage. If you really want to know how your drive or a drive you are considering to use will perform to a specific workload, contact Calypso for custom test services.
How do I start?
Create an account and do your free IO Capture NOW. If you are interested in more advanced metrics, contact Calypso for IOProfiler Testers or Test Services.
If you find the IPF to be interesting and useful, be sure to tell a friend. Remember, the more IO captures that are uploaded to the IPF database the better to help the industry understand what actually goes on when you run your computer.


